plots <- cascade::prepare_tima_annotations(
  show_example = TRUE
) |>
  cascade::plot_tima()
# cascade::prepare_tima_annotations(
#   annotations = list(
#     "yourExperiment1"="PathToYourTimaOutput1",
#     "yourExperiment2"="PathToYourTimaOutput2"
#     )
# ) |>
# cascade::plot_tima()This vignette describes additional helper functions to visualize TIMA results.
Visualization
To check the full results:
plots$histogram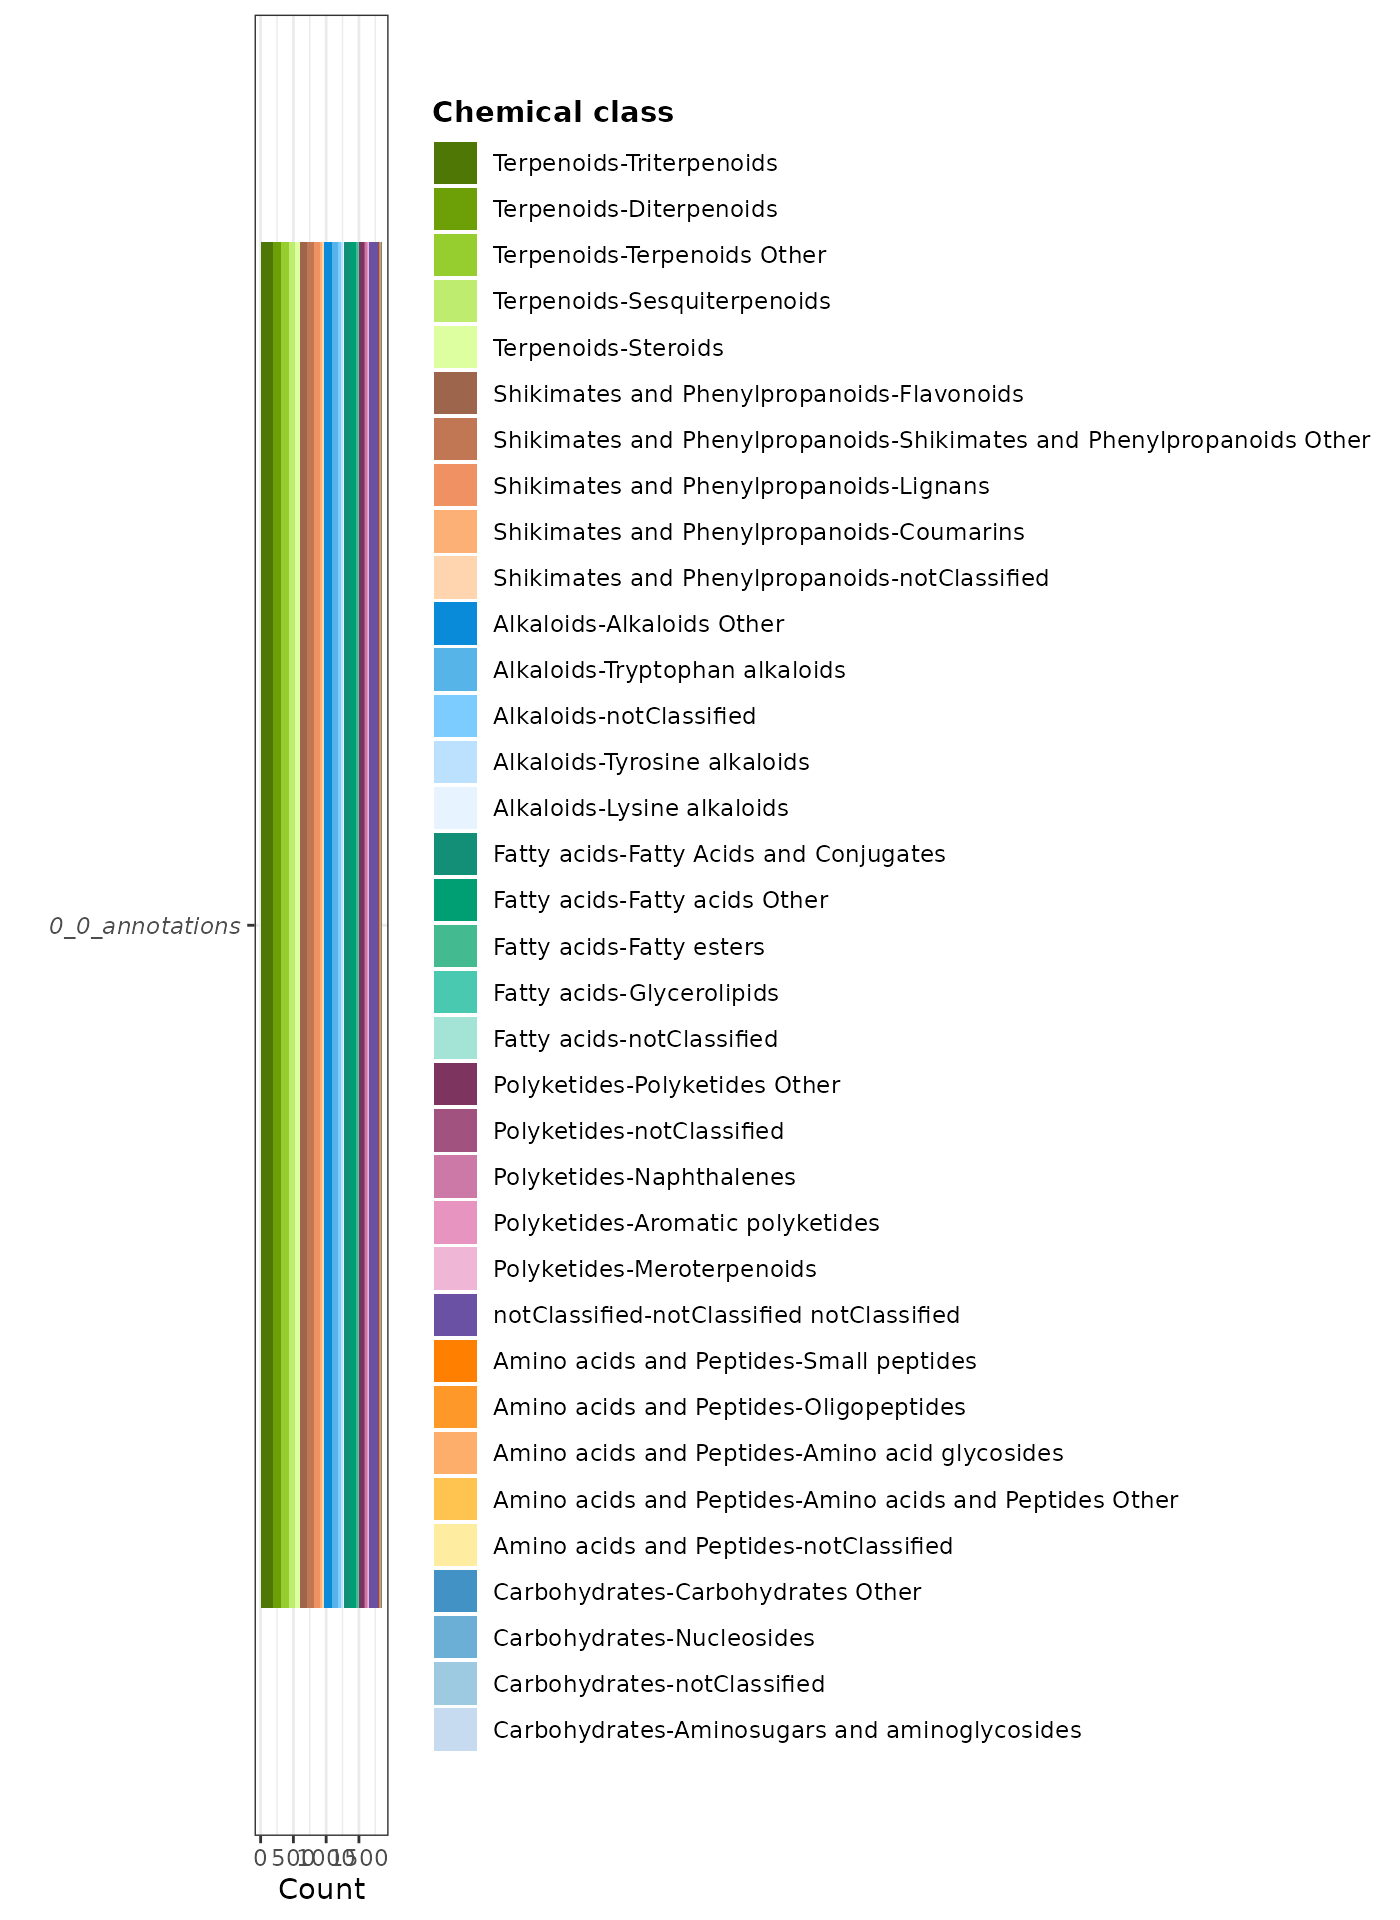
plots$treemap
plots$sunburstTo compare annotated and predicted classes:
list(
  cascade::prepare_tima_annotations(
    show_example = TRUE
    ),
  cascade::prepare_tima_annotations(
    show_example = TRUE,
    predicted_classes = TRUE
    )
  ) |>
  tidytable::bind_rows() |>
  list() |>
  cascade::plot_tima() |>
  purrr::pluck("histogram")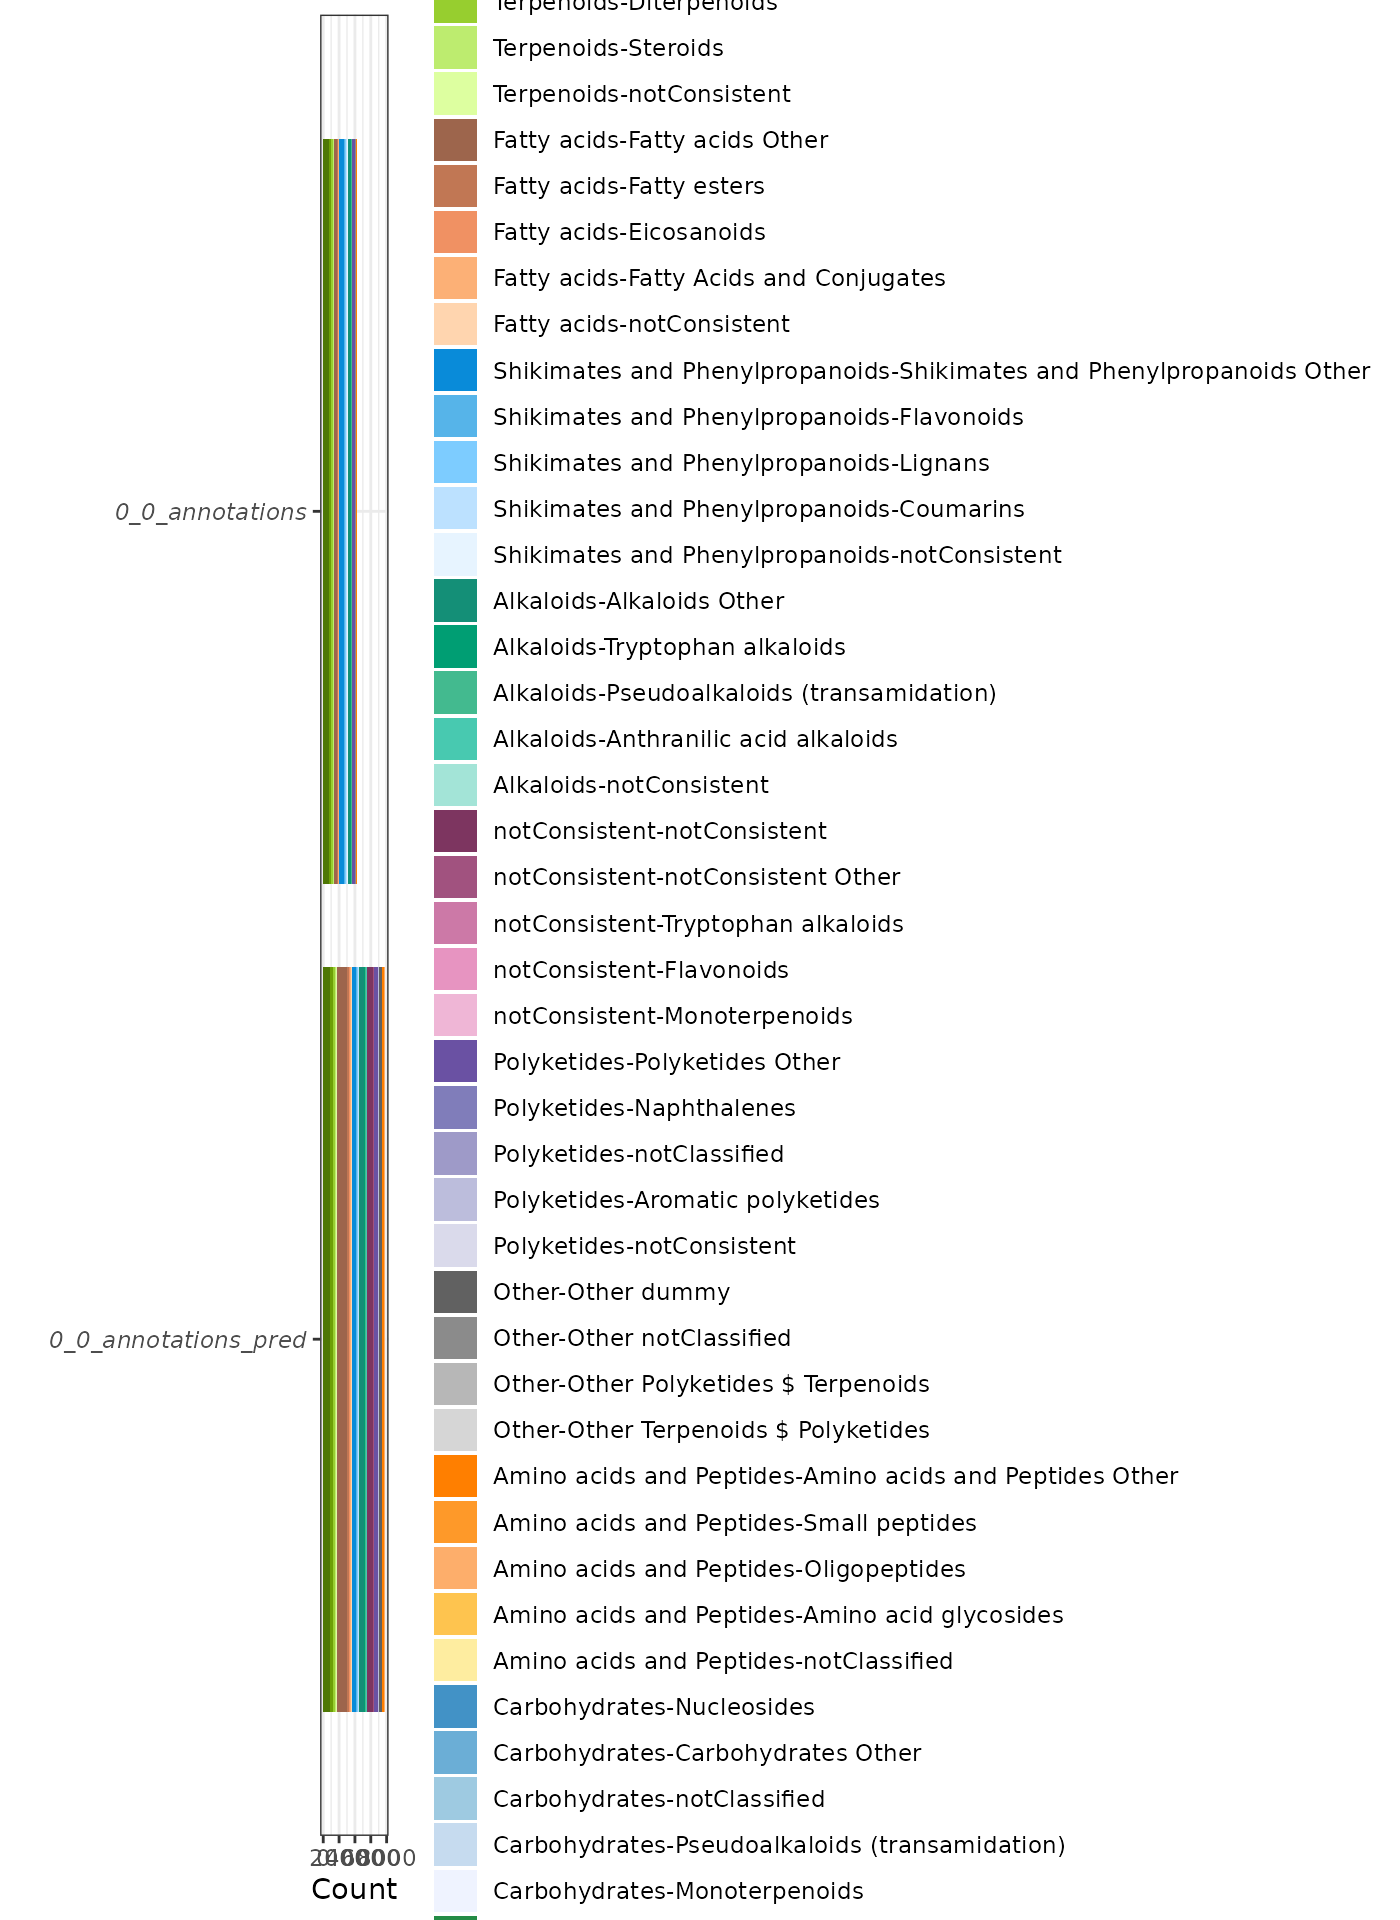
To compare different filtering thresholds:
list(
  cascade::prepare_tima_annotations(
    show_example = TRUE
  ),
  cascade::prepare_tima_annotations(
    show_example = TRUE,
    min_score_biological = 0.2,
    min_score_final = 0.4
  ),
  cascade::prepare_tima_annotations(
    show_example = TRUE,
    min_score_initial = 0.2,
    min_score_biological = 0.2,
    min_score_chemical = 0.2,
    min_score_final = 0.4,
    min_matched_peaks_absolute = 6L,
    min_matched_peaks_percentage = 0.5,
    min_peaks = 10L
    )
  ) |>
  tidytable::bind_rows() |>
  list() |>
  cascade::plot_tima() |>
  purrr::pluck("histogram")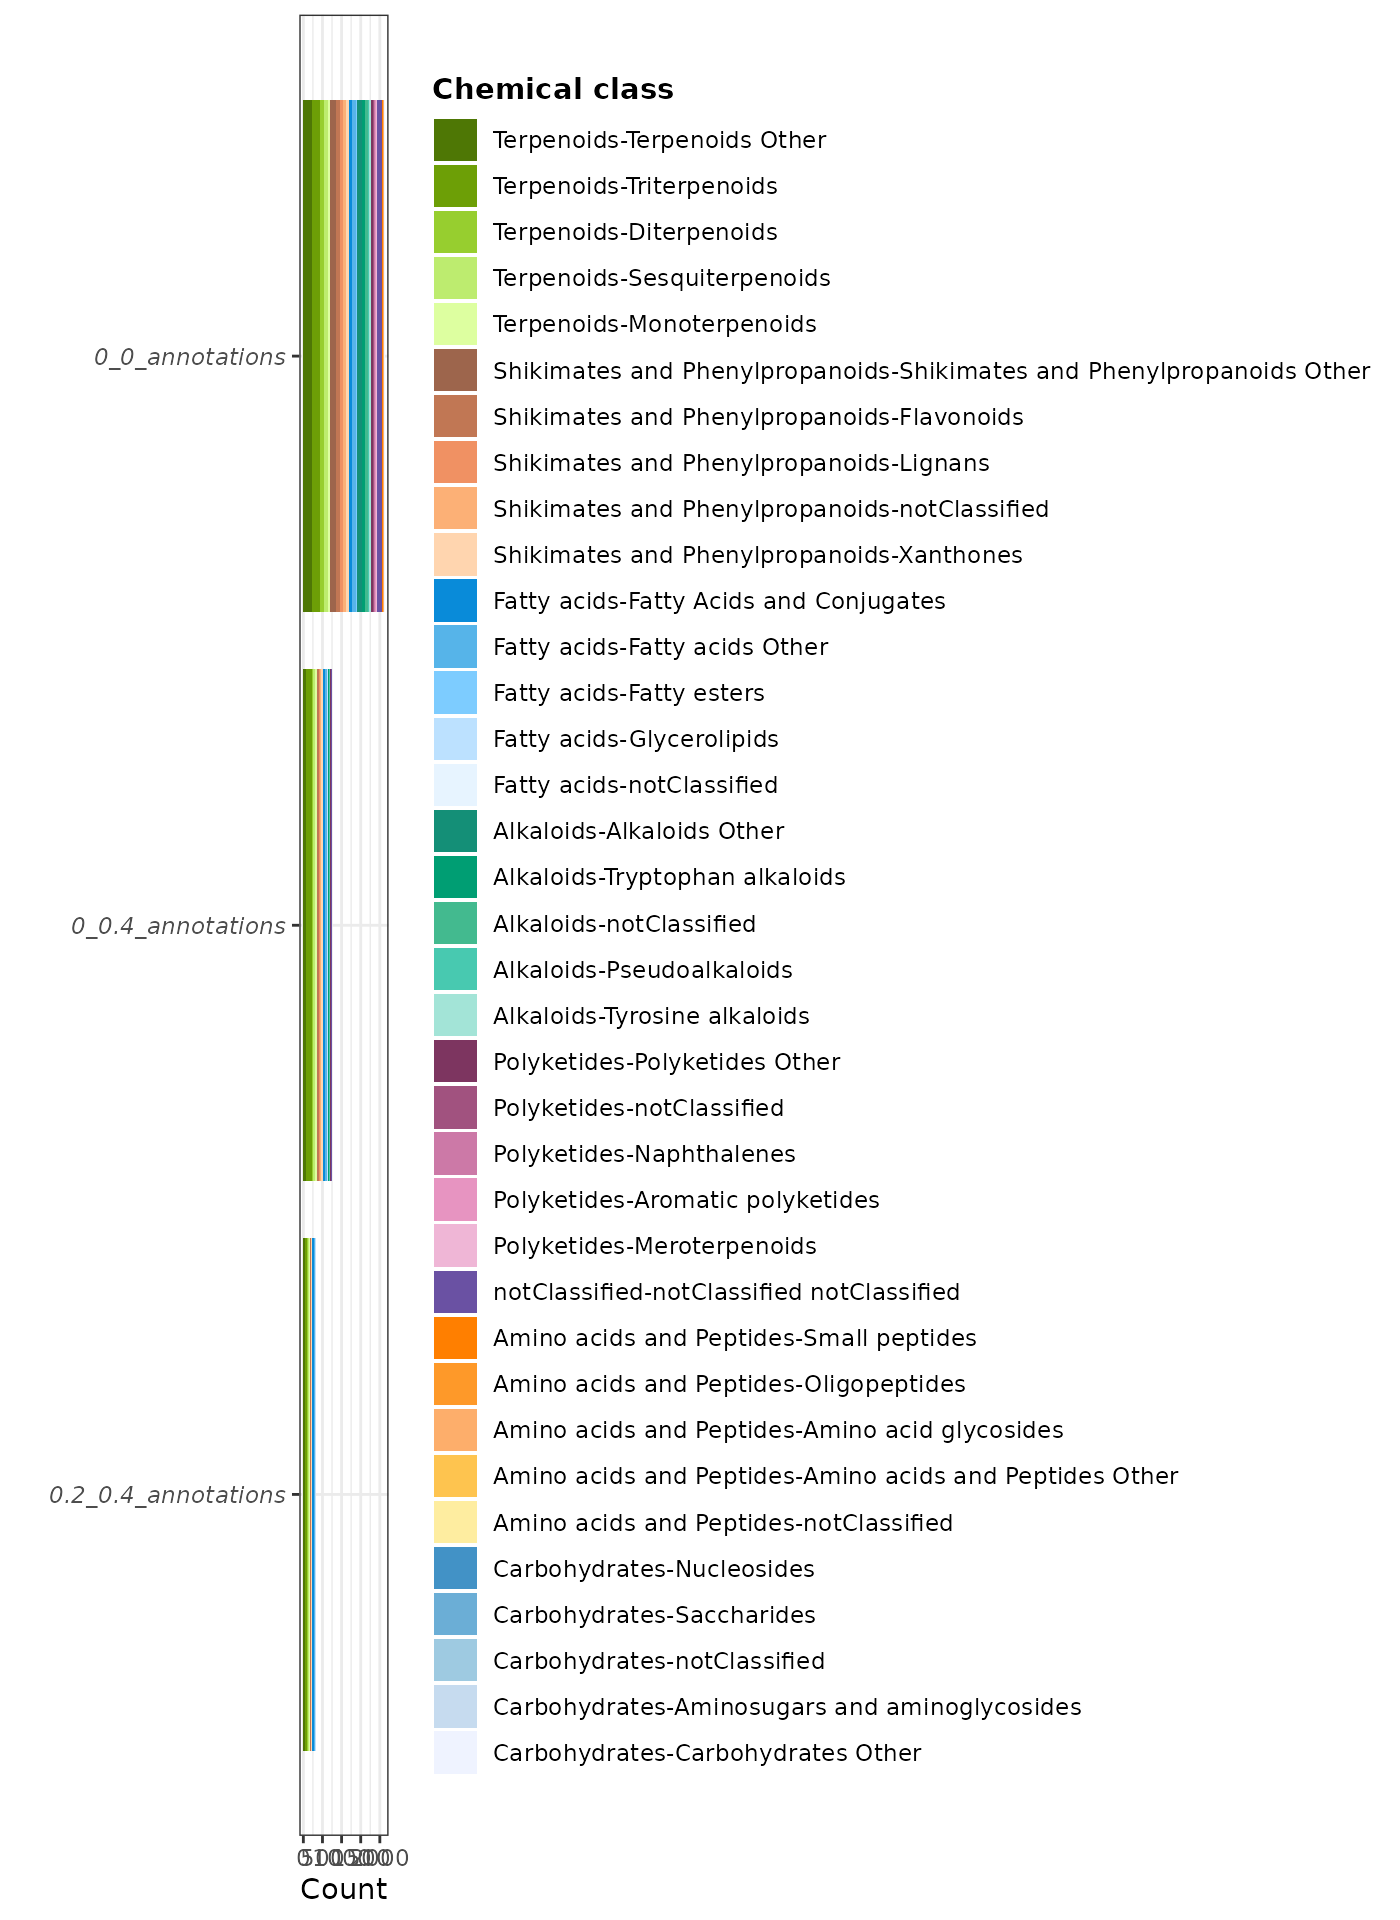
We hope you enjoyed using CASCADE and are pleased to hear from you!
For any remark or suggestion, please fill an issue or feel free to contact us directly.